 Tasaheel ERP
KPIs and Financial Ratios: Profitability, Liquidity, Operating Cycle
Key financial ratios for owners and how to read them: margins and EBITDA, current and quick ratios, gearing, collection and inventory days, and the cash cycle.
 By Sherif Fadl — Founder, Tasaheel ERP
Profit alone doesn't tell you how healthy your business is: you can be profitable and run out of cash, or sell a lot and wait months to collect. Financial ratios turn statement figures into answers: are we profitable? Can we pay? How many days is our money tied up?
Profitability
- Gross margin = gross profit ÷ revenue — how much of each riyal is left after the cost of goods.
- Operating profit — after operating expenses.
- EBITDA = operating profit + depreciation and amortisation — the business's ability to generate cash before financing and depreciation.
- Net profit and return on equity.
Liquidity and working capital
- Working capital = current assets − current liabilities.
- Current ratio = current assets ÷ current liabilities — comfortable is usually 1.5 or more.
- Quick ratio = (current assets − inventory) ÷ current liabilities — liquidity without relying on selling stock.
- Debt to equity — how much the business relies on borrowing.
The operating cycle
- Collection days = receivables × days in the period ÷ revenue.
- Payment days = payables × days in the period ÷ cost of sales.
- Inventory days = inventory × days in the period ÷ cost of sales.
- Cash cycle = collection days + inventory days − payment days — the days between paying your supplier and collecting from your customer.
How to read them
Compare each ratio with the previous period, not just the number. A gross margin under 20%, a current ratio under 1, collection over 60 days or inventory over 90 days — all are signals worth stopping at.
How Tasaheel Accounts manages KPIs
- KPIs: for any period and cost centre, with the change against the previous period of the same length, in three groups: profitability, liquidity and working capital, and the operating cycle — plus a monthly trend and a quick reading that flags weak indicators.
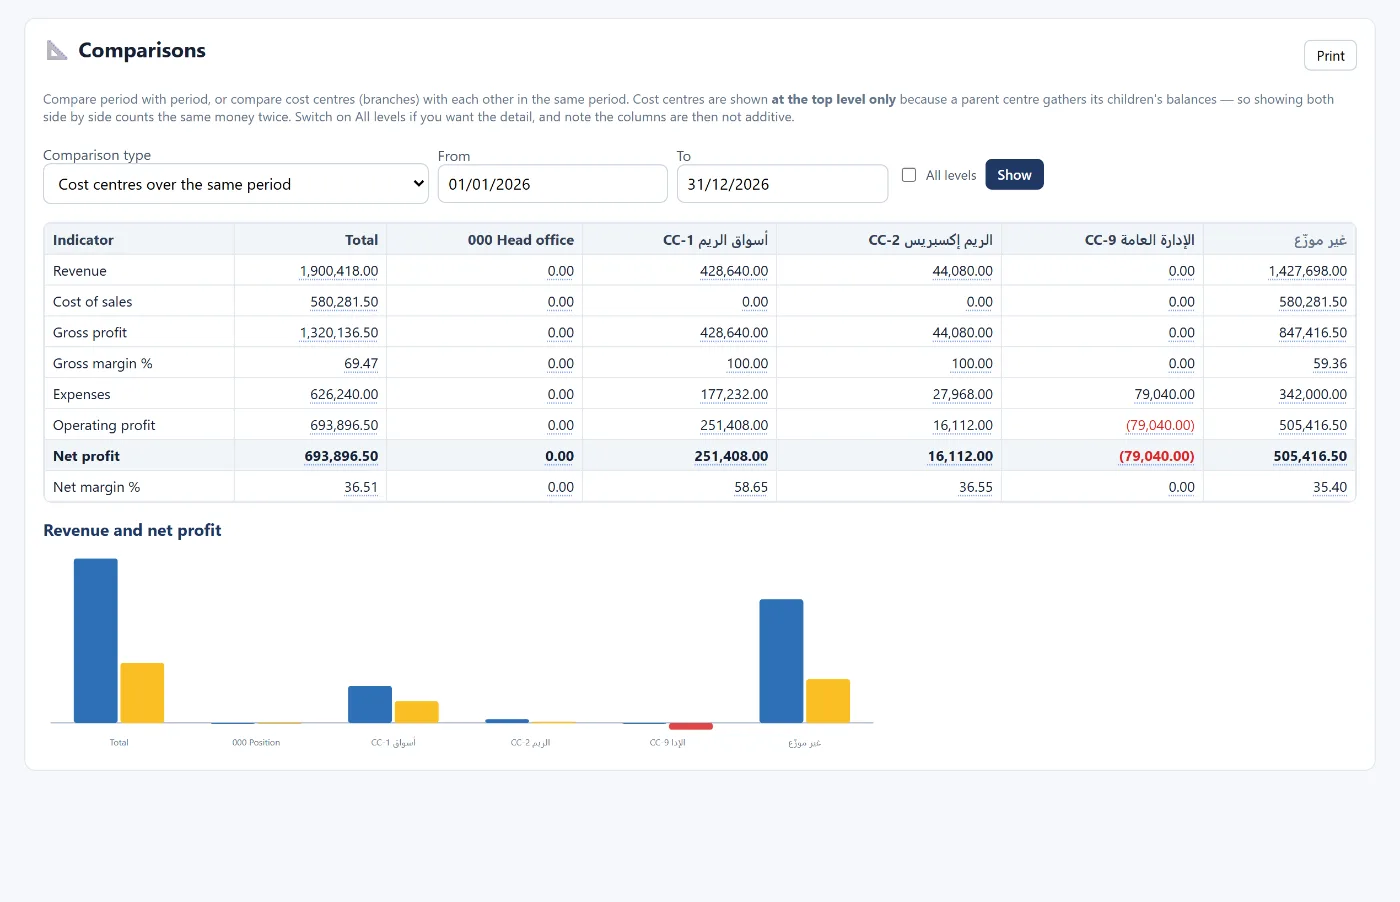
- Comparisons: period against period, the months of a period, year on year, or cost centres side by side.
- Expense analysis: total expenses against the previous period, their share of revenue, and the daily average.
- Days are calculated from period-end balances.
Read also how to read your financial statements and cash flow management, or learn more about Tasaheel Accounts.
FAQ
What is a good current ratio?
Usually 1.5 or more; below 1 means short-term liabilities exceed short-term assets.
What is the cash cycle?
The days between paying your supplier and collecting from your customer — the shorter it is, the less cash you need.
Why compare with the previous period?
Because the trend says more than the number: a 25% margin is good, but worrying if it was 35% a month ago.
Can I see KPIs per branch?
Yes, by choosing the cost centre.
Try it in Tasaheel: create a free account and open the KPIs for your period.